Why 70% of Multi-Location Restaurants Lose 8–15% of Operational Profit Without Real-Time Analytics
Growth can hide inefficiency.
A restaurant opens 3 outlets.
Then 6.
Then 12.
Revenue increases.
Brand visibility improves.
Customer demand stabilizes.
Yet profitability does not scale proportionately.
Margins tighten.
Food cost creeps upward.
Inventory feels heavier.
Reporting takes longer.
Leadership senses friction.
Not in revenue.
In control.
Most multi-location restaurant chains are not losing customers.
They are leaking operational profit.
Quietly.
Incrementally.
Systematically.
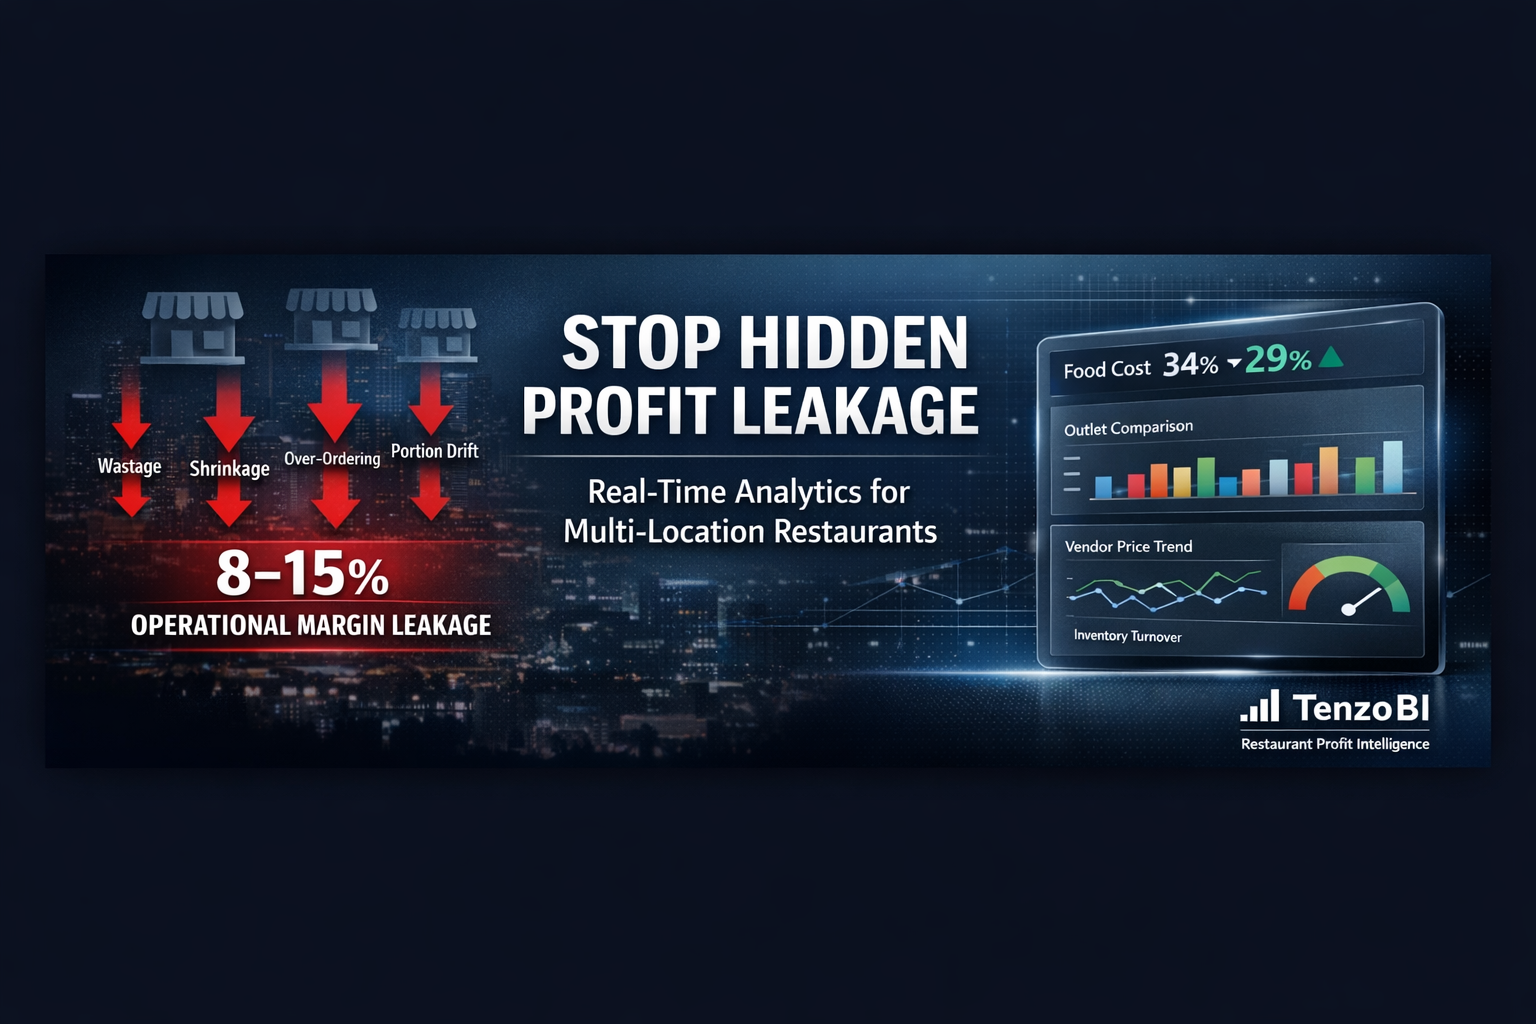
Industry audits and operational benchmarks suggest that multi-outlet restaurants lose between 8–15% of operational margin due to inventory blind spots, delayed reporting, decentralized procurement, and lack of real-time visibility.
Not because they lack effort.
Because they lack intelligence at the right time.
This article examines:
• Where operational profit leaks
• Why traditional reporting systems fail at scale
• How margin erosion compounds silently
• What real-time restaurant analytics changes
• And how structured visibility restores control
If you operate 5 or more outlets, this is structural — not theoretical.
The Hidden Profit Leakage in Multi-Location Restaurants
Operational profit leakage rarely appears as one dramatic problem.
It accumulates through small daily variances.
Each seems manageable.
Together, they create measurable erosion.
Let’s break it down.
1. Food Wastage (2–6%)
Food wastage is often underestimated.
It happens in layers.
Overproduction.
Improper forecasting.
Shelf-life mismanagement.
Untracked spoilage.
In centralized kitchen models, wastage compounds across outlets.
In decentralized kitchens, duplication amplifies it.
A chain with $5 million annual procurement experiencing 4% wastage loses:
$200,000 per year.
That’s not a rounding error.
That’s structural margin loss.
2. Over-Ordering & Inventory Inefficiency (3–7%)
As restaurants scale, procurement decentralizes.
Outlet managers order defensively.
They prefer surplus over shortage.
Without centralized consumption analytics:
• Each outlet builds its own safety buffer
• Procurement becomes fragmented
• Inventory levels inflate
Working capital gets locked in stock.
Cash flow tightens.
Dead inventory risk increases.
Inventory inefficiency does not show up in daily sales dashboards.
But it directly impacts liquidity and EBITDA.
3. Shrinkage & Internal Variance (1–3%)
Shrinkage is uncomfortable to discuss.
But it exists in every multi-location system.
Small unrecorded consumption.
Reconciliation gaps.
Inventory adjustments without root-cause tracking.
Across 12 outlets, even 2% shrinkage on $5 million equals:
$100,000 annually.
When reporting cycles are weekly or monthly, loss normalizes.
Visibility delay compounds leakage.
4. Portion Control Drift (1–4%)
Standard recipes assume discipline.
Operational reality varies.
Different chefs.
Different shifts.
Different training levels.
A 5–10 gram excess per serving on a high-volume SKU may seem minor.
But across thousands of servings daily, cost variance compounds significantly.
Most chains identify this during periodic audits.
By then, the financial impact has already accumulated.
5. Dead Inventory & Menu Complexity (1–5%)
Menu expansion increases operational complexity.
Promotional ingredients.
Seasonal SKUs.
Limited-time offerings.
Without SKU-level intelligence, certain ingredients move slowly.
They expire.
They are written off.
Dead inventory reduces gross margin and signals weak demand forecasting.
When Small Percentages Become Large Numbers
Let’s model conservatively:
Wastage: 4%
Over-ordering inefficiency: 4%
Shrinkage: 2%
Portion drift: 2%
Total: 12% operational margin impact.
On $5 million annual procurement:
12% equals $600,000 in lost operational margin.
This is not revenue loss.
This is preventable operational leakage.
Why Traditional Reporting Systems Collapse Beyond 5 Outlets
Many restaurant chains evolve operationally.
But not technologically.
They rely on:
• Excel spreadsheets
• Email-based stock reports
• POS exports
• Manual consolidation
• Weekly variance reviews
These systems work for 2–3 outlets.
They fail at 8–10.
Here’s why.
Reporting Lag
Inventory moves daily.
Reports are reviewed weekly.
Leadership reacts to history.
Not live signals.
Corrective action is delayed.
Leakage continues during review cycles.
Manual Bias & Narrative Reporting
Numbers are interpreted before submission.
Variances are softened.
Adjustments are rationalized.
Without automated validation, subjectivity enters the system.
Objectivity fades.
No Centralized SKU-Level Intelligence
Most chains track total food cost.
Few track SKU-level contribution daily.
Without granular insight:
• High-loss SKUs stay active
• Low-margin items dominate
• Procurement alignment weakens
Visibility becomes surface-level.
Vendor Price Variance Blindness
Vendor pricing changes gradually.
Without centralized tracking:
• Small increases go unnoticed
• Volume negotiation opportunities are missed
• Procurement leverage declines
Across multi-location operations, this compounds quickly.
The Shift: From Reporting to Real-Time Restaurant Analytics
Real-time restaurant analytics software changes operational dynamics.
It converts static reports into live intelligence.
From descriptive to diagnostic.
From reactive to preventive.
Live Inventory Visibility
Outlet-level stock levels.
Central kitchen transfers.
Consumption variance tracking.
Auto-flagged anomalies.
Available daily.
Not monthly.
When visibility is constant, behavior improves.
Accountability increases.
Instant Outlet Comparison
Which branch’s food cost increased yesterday?
Which outlet deviates from standard recipe cost?
Which location is over-ordering?
Real-time dashboards answer instantly.
Without waiting for month-end reviews.
Vendor Performance Monitoring
Aggregated procurement data reveals:
• Price trend shifts
• Volume optimization potential
• Supply inconsistencies
This reduces procurement leakage by 2–4%.
Recipe & Portion Intelligence
Standard cost mapped.
Actual usage tracked.
Deviation flagged.
Corrective action happens within days.
Not months.
Case Scenario: 12-Outlet QSR Chain
12 outlets.
$5 million annual procurement.
Before structured analytics:
Food cost: 34%
Shrinkage: unquantified
Dead stock: recurring
Vendor variance: untracked
After real-time tracking implementation:
Food cost reduced by 5%
Shrinkage reduced by 1.5%
Procurement savings: 2%
Total operational improvement: 8.5%.
On $5 million procurement:
8.5% equals $425,000 in annual operational improvement.
Without opening new outlets.
Without raising menu prices.
Without increasing marketing spend.
Just structured visibility.
Revenue Growth vs Margin Recovery
To generate $425,000 net profit via revenue growth:
You may need several million dollars in additional sales.
Which requires:
Marketing expansion.
Staff scaling.
Operational complexity.
Margin recovery through analytics requires:
Visibility.
Process discipline.
Data intelligence.
It is operational optimization.
Not expansion risk.
KPIs That Actually Matter in Multi-Location Restaurant Management
Many chains track:
Footfall.
Total sales.
Average order value.
Important.
But incomplete.
Critical KPIs include:
• Daily food cost percentage
• SKU-level margin
• Inventory turnover ratio
• Dead stock percentage
• Outlet contribution margin
• Vendor price trend index
Without real-time monitoring, decision-making remains partial.
Frequently Asked Questions
How much profit do multi-location restaurants lose due to poor inventory control?
Industry patterns suggest 8–15% operational margin loss due to wastage, over-ordering, shrinkage, and reporting delays.
Can restaurant analytics software reduce food cost?
Yes. When implemented correctly, real-time analytics reduces food cost by 3–8%.
Why is Excel insufficient for managing 10+ outlets?
Excel lacks automated anomaly detection, real-time comparison, and centralized validation required for multi-location control.
What is the biggest hidden cost in restaurant chains?
Delayed visibility. By the time variance is reviewed, it has already compounded.
The Leadership Perspective
Founders seek scalable growth.
CFOs seek margin stability.
Operations leaders seek consistency.
All three require centralized operational intelligence.
Without real-time analytics:
Growth amplifies inefficiency.
With structured visibility:
Growth becomes controlled and profitable.
How TenzoBI Enables Profit Intelligence
TenzoBI is purpose-built for multi-location restaurant chains.
It is not generic BI software.
It is not merely reporting automation.
It is a restaurant analytics platform focused on operational margin intelligence.
TenzoBI provides:
• Real-time inventory visibility
• Outlet-level food cost tracking
• SKU variance monitoring
• Vendor performance analytics
• Recipe deviation alerts
• Executive-level dashboard consolidation
It centralizes operational data into structured intelligence.
So leadership can:
• Identify margin erosion early
• Reduce wastage systematically
• Improve procurement negotiation
• Standardize operational discipline
• Save executive reporting time
Instead of reviewing spreadsheets, executives review insights.
Instead of reacting monthly, teams correct daily.
Final Reflection
Multi-location restaurant management today is not about expansion alone.
It is about control.
Operational profit does not disappear dramatically.
It erodes daily.
8–15% margin leakage is common.
The difference between average and optimized chains is visibility.
Real-time intelligence.
Structured accountability.
Request a TenzoBI Demo
If you operate multiple restaurant outlets and notice:
• Food cost drift
• Inventory inefficiency
• Reporting delays
• Outlet inconsistency
It is time to evaluate your visibility framework.
Get a structured operational margin assessment.
See how real-time restaurant analytics can recover cost, improve control, and save executive time.
Because in multi-location restaurant management, visibility is no longer optional.
It is a competitive advantage.